

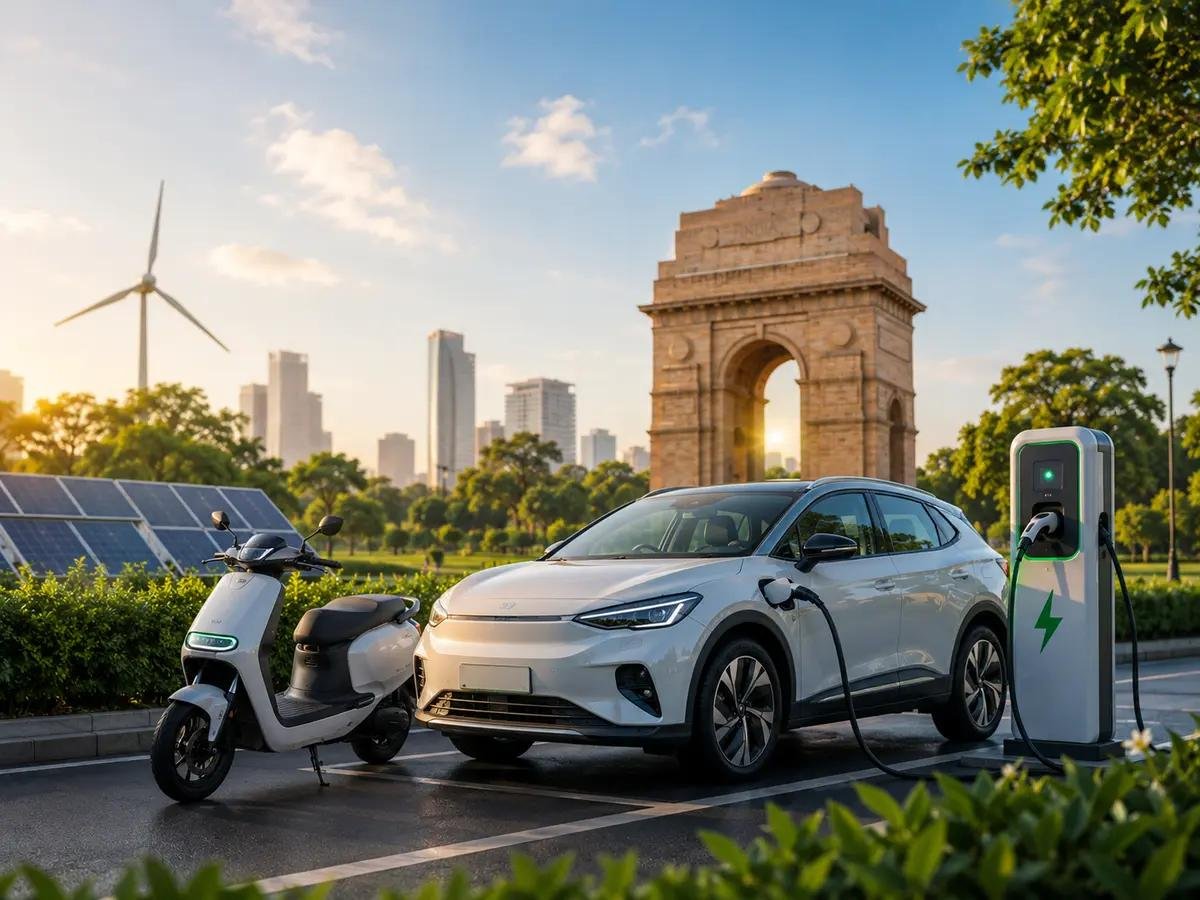
India’s EV sales surged 74% in September 2026. Explore electric car demand, two-wheeler growth, charging infrastructure and the future of electric mobility.
India’s electric vehicle industry has recorded a significant milestone, with retail sales reaching their highest monthly level in September 2026.
According to data released by the Federation of Automobile Dealers Associations (FADA), total electric vehicle retail sales reached 333,634 units during the month.
The figure represented approximately 74% year-on-year growth.
Electric vehicles accounted for around 13% of retail sales across vehicle categories, compared with approximately 10% in September 2025.
The growth was supported by festive-season demand, expanding product availability, improving running-cost economics and policy support. IBEF
The results suggest that electric mobility is gaining wider acceptance across multiple vehicle categories.
However, the industry still faces challenges involving charging infrastructure, affordability, battery durability and long-term profitability.
Electric vehicle sales: September 2026 snapshot
Total EV retail sales
333,634
+74% year-on-year
EV market penetration
~13%
Across vehicle categories
September 2026 EV retail sales by category
India, units sold. Source: FADA data reported by IBEF.
055,000110,000165,000220,000Two-wheelersThree-wheelersPassenger carsCommercial
Source: FADA September 2026 retail data, published by India Brand Equity Foundation on October 8, 2026. IBEF
The category-wise data reveals that India’s electric vehicle market is not being driven by passenger cars alone.
Electric two-wheelers and three-wheelers remain major contributors to overall adoption.
Electric two-wheelers lead the transformation
Electric two-wheelers recorded 207,314 retail sales in September 2026.
This represented an increase of approximately 88.7% compared with September 2025.
The category also recorded month-on-month growth of approximately 13.2%.
Electric two-wheeler penetration increased to 11.6%, compared with 8.2% a year earlier.
The strong performance reflects the practical appeal of electric scooters and motorcycles for daily urban transportation.
Many two-wheeler users travel relatively predictable distances.
For commuters who can charge at home, electric vehicles may offer attractive operating-cost advantages.
The economic benefits depend on electricity tariffs, vehicle efficiency, maintenance costs, battery performance and purchase price.
Electric two-wheelers may also appeal to delivery workers and fleet operators who accumulate substantial daily mileage.
However, consumers should carefully assess service-network availability and battery warranty conditions.
Electric passenger vehicles gain momentum
Electric passenger vehicle sales reached 36,108 units in September 2026.
This represented approximately 94.6% year-on-year growth and 17.6% month-on-month growth.
Electric passenger vehicle penetration increased from 5.7% to 8.5% over the year.
These figures indicate that electric cars are gaining acceptance beyond a small group of early adopters.
A wider selection of models, improving vehicle range and greater consumer awareness may contribute to adoption.
However, affordability remains a major consideration.
Electric cars frequently require a higher initial investment than comparable internal-combustion-engine vehicles.
The potential savings arise over time through electricity costs and, depending on the model, maintenance expenses.
Consumers should calculate total ownership costs rather than relying only on advertised running-cost comparisons.
Electric three-wheelers demonstrate commercial viability
Electric three-wheelers recorded 86,024 sales in September 2026, representing approximately 40% year-on-year growth.
The category’s EV penetration reached approximately 64.9%.
This makes three-wheelers one of the most advanced segments of India’s electric mobility transition.
The commercial economics of three-wheelers differ from those of private passenger cars.
Vehicles used for passenger transport or local deliveries often operate for long hours and cover predictable routes.
High utilization can make fuel savings particularly valuable.
For fleet operators, charging schedules and vehicle downtime become important operational considerations.
Electric three-wheelers may also contribute to reducing local tailpipe emissions in congested urban areas.
However, environmental benefits across the full vehicle lifecycle depend on electricity generation, battery manufacturing and recycling practices.
Commercial electric vehicles show strong growth
Electric commercial vehicle retail sales reached 4,188 units in September.
The category recorded approximately 158% year-on-year growth, although sales declined by around 10.9% compared with August.
Electric vehicle penetration in the commercial segment reached approximately 4%.
The relatively small absolute volume suggests substantial room for future development.
Potential applications include urban deliveries, municipal services and short-distance logistics.
However, heavier commercial vehicles present additional challenges.
Battery weight, payload requirements, charging speed and route distance can influence operating economics.
Fleet operators must also consider charging infrastructure at depots and delivery locations.
Commercial electrification may therefore progress unevenly across vehicle types.
What is driving India’s EV adoption?
Several factors appear to be contributing to market expansion.
1. Improving running-cost economics
Electric vehicles generally convert a higher proportion of stored energy into vehicle movement than conventional combustion-engine vehicles.
For drivers with high annual mileage, this efficiency can translate into lower energy expenditure.
However, savings depend on local electricity and fuel prices.
2. Expanding vehicle choices
As manufacturers introduce additional electric models, consumers gain more options across price points, vehicle sizes and intended uses.
Greater competition may improve product features and service availability.
3. Government policy support
Central and state-level policies can influence vehicle adoption through incentives, infrastructure programs and manufacturing support.
The PM E-DRIVE initiative is among the policy measures identified in the FADA-related reporting as supporting the market.
Consumers should verify the current eligibility and availability of any incentive before purchasing a vehicle.
4. Greater environmental awareness
Air pollution and emissions concerns have increased interest in cleaner transportation.
Electric vehicles produce no tailpipe emissions during operation.
However, a complete environmental comparison must also consider electricity generation, battery production and end-of-life management.
The charging infrastructure challenge
Charging availability remains one of the most important determinants of electric vehicle adoption.
For consumers with dedicated parking and home charging facilities, daily ownership can be relatively convenient.
For apartment residents without assigned parking or charging access, the situation may be more complicated.
Public charging networks must address reliability, payment interoperability, connector compatibility and geographical coverage.
Long-distance travel introduces additional requirements.
Drivers need confidence that charging stations will be operational and available along their intended routes.
Charging time also varies according to battery size, charger capacity, battery temperature and vehicle specifications.
Therefore, the existence of a charging station does not automatically guarantee a convenient charging experience.
Battery durability and resale value
Battery technology plays a central role in the economics of electric vehicle ownership.
Lithium-ion batteries gradually lose some capacity through usage and ageing.
The rate of degradation depends on battery chemistry, thermal management, charging patterns and operating conditions.
Consumers should evaluate battery warranties and the manufacturer’s policies regarding capacity retention.
Resale value is another important consideration.
The used-electric-vehicle market is still developing, and resale prices may be influenced by battery condition, technology improvements and consumer confidence.
Independent battery health assessments could become increasingly valuable as the market matures.
How to compare electric and petrol vehicle ownership costs
Consider a hypothetical passenger vehicle driven 15,000 kilometres annually.
Assume a petrol car delivers 15 kilometres per litre and petrol costs ₹100 per litre.
Annual petrol consumption would be approximately 1,000 litres, resulting in fuel expenditure of ₹100,000.
Now assume an electric vehicle consumes 0.15 kWh per kilometre and electricity costs ₹8 per kWh.
Annual electricity consumption would be approximately 2,250 kWh, costing ₹18,000.
Under these assumptions, the annual energy-cost difference would be ₹82,000.
This example is illustrative and does not represent the costs of a particular vehicle.
It excludes charging losses, financing, insurance, maintenance, depreciation, battery replacement and the initial purchase-price difference.
These additional costs are essential when calculating total ownership economics.
Opportunities for India’s automotive supply chain
Rising EV adoption creates opportunities beyond vehicle manufacturers.
Potential beneficiaries include companies involved in battery components, power electronics, charging equipment, electrical connectors and automotive software.
Manufacturers of thermal-management systems, vehicle sensors and energy-management technology may also experience changing demand.
The transition could create new opportunities for domestic suppliers and MSMEs.
However, increased demand does not automatically translate into higher profits for every company.
Competition, capital expenditure, imported components and technology changes can affect profitability.
Investors should examine company-specific fundamentals rather than assuming that all EV-related businesses will benefit equally.
What EV buyers should consider in 2026
Prospective buyers should evaluate their actual driving requirements before choosing an electric vehicle.
Daily distance, home charging access, highway usage and local service support are particularly important.
A vehicle with an exceptionally large battery may not be necessary for a commuter travelling short distances.
Conversely, buyers who regularly travel long routes should evaluate real-world range and charging availability.
The manufacturer’s warranty, service-network quality and vehicle safety record should also influence purchasing decisions.
For commercial users, operating uptime may be more important than advertised range.
DAO Analysis: India’s EV transition is gaining commercial depth
September’s record sales indicate that India’s electric vehicle industry is moving toward broader adoption.
The strongest evidence comes from the diversity of categories experiencing growth.
Electric two-wheelers, passenger vehicles, three-wheelers and commercial vehicles all recorded substantial year-on-year increases.
Nevertheless, the next phase of expansion will depend on affordability, charging reliability and product quality.
Manufacturers will also need to demonstrate sustainable profitability as competition intensifies.
For consumers, the market is becoming more competitive and offers a growing range of choices.
For investors, the opportunity extends across the automotive value chain, but careful analysis remains essential.
India’s electric mobility transition appears increasingly significant, although its long-term success will depend on infrastructure, economics and consumer confidence.
Editorial reference: India Brand Equity Foundation — September 2026 EV Sales Report.
Disclaimer: This article is intended for general information and industry analysis. Vehicle cost comparisons are hypothetical and should not be interpreted as manufacturer claims or investment recommendations.












Leave a Reply